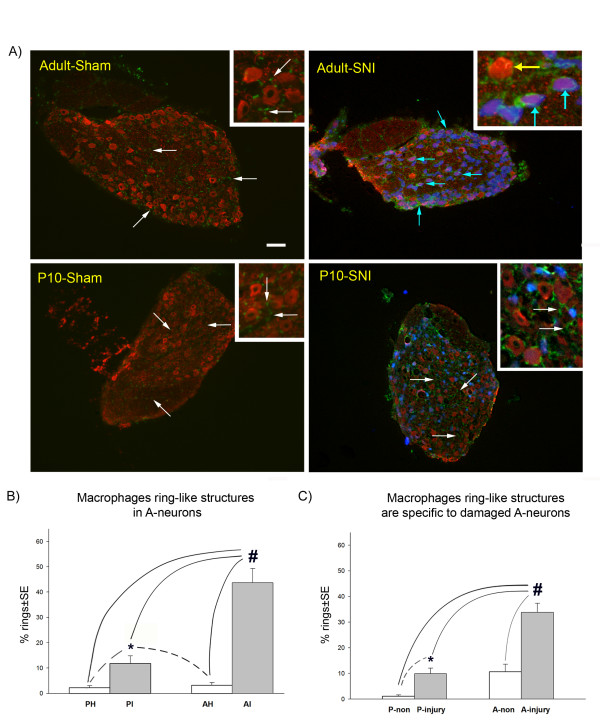
Figure 6.
The effect of postnatal age on the distribution of macrophages in the dorsal root ganglia after spared nerve injury (SNI). A) Shows large A-neurons (in red, NF200 +ve cells) and macrophages (in green, IBA-1 +ve) in adult or young rats in sham and injured groups (7 days after nerve injury). Both young and adult sham groups have inactivated macrophages (white arrows). In contrast, in adult animals post injury, the macrophages have large cell bodies (blue arrows) which form a 'ring-like' structure that surround the large, injured A-neurons. The majority of non-injured neurons do not have these rings (yellow arrow). In young SNI animals (P10, 10 days old at the time of nerve injury) the macrophage distribution is similar to the sham groups (white arrows) with a small increase in 'ring-like' structures which is only significant when compared to the sham groups. B) Counts of 'ring-like' structures in young and adult DRG 7 days post SNI surgery. PI: ipsilateral SNI surgery at 10 days old; PH: sham at 10 days old, AI: ipsilateral to SNI surgery in adult; AH: sham in adult. *: indicates statistically significance when compared to the sham groups; #: indicates statistical significance when compared to all experimental groups (ANOVA p < 0.001; SNK p < 0.05; n = 2219 A-neurons from 3 animals; power>80%). C) Counts of 'ring-like' structures in damaged or non-damaged neurons in adult and young SNI operated animals. A preferential attraction of macrophages towards damaged large A-neurons is evident in the adult SNI group. P-non: non damaged A-neurons in young rats; P-injury: damaged A-neurons in young rats; A-non: non damaged A-neurons in adult rats; A-injury: damaged A-neurons in adult rats. Fluorogold (in blue) was used as a retrograde tracer injected at the site of the injury, to label damaged neurons. #: indicates statistical significance in all experimental groups (ANOVA p < 0.001; SNK p < 0.05; n = 559 A-neurons from 3 animals; power>80%) *: indicates statistical significance (t-test p < 0.005) when an independent t-test was performed on the young groups only (dashed lines). SE: standard error. Scale bar: 100 μm.

