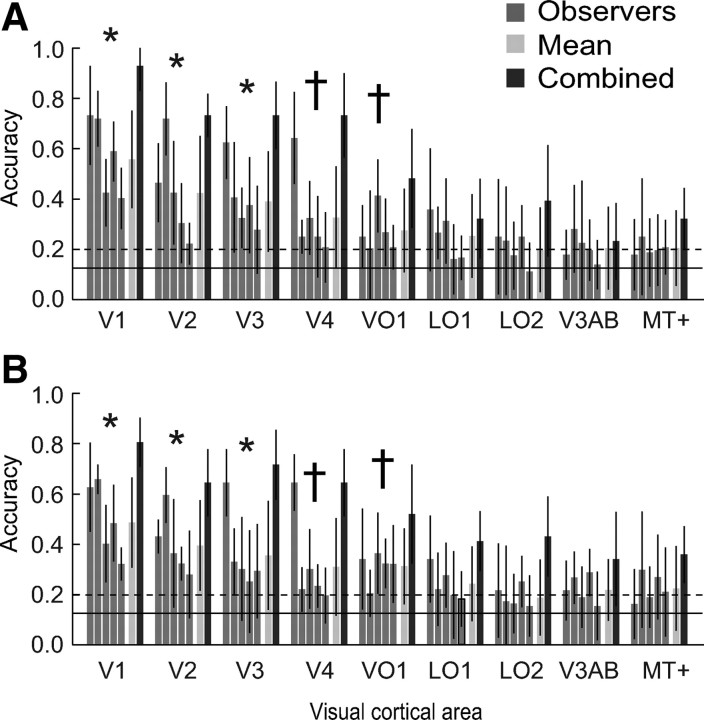
Figure 4.
Color decoding. A, Decoding accuracies obtained with the maximum likelihood classifier, for each visual area. Gray bars, Decoding accuracies for individual observers. Light bars, Mean across observers. Dark bars, Accuracies obtained by combining the data across observers before classification. *p < 0.05, visual areas for which accuracies were significantly above chance in all observers (2-tailed permutation test); †p < 0.05, areas for which accuracies were significantly above chance in at least three of five observers. Error bars indicate SDs across runs (with 1 run at a time left out of training and used for testing accuracy). Solid line, Chance accuracy (0.125%). Dashed line, 97.5 percentile for chance accuracy, obtained by permutation tests (see Materials and Methods). The 97.5 percentiles were computed separately for each observer and visual area, but the average across observers/ROIs is shown here for simplicity. B, Decoding accuracies obtained using the forward model. Same format as in A.

