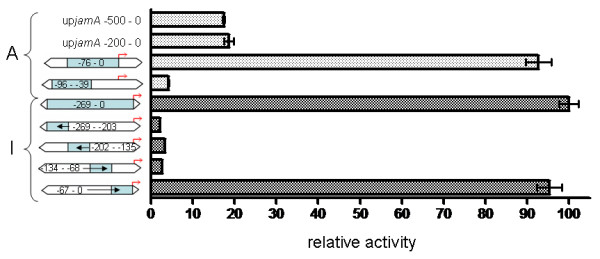
Figure 5.

Activity of truncated upjamA and upjamI regions in the β-galactosidase assay. Trimmed regions are represented by blue shaded figures with associated base pair numbers. Red arrows indicate the start codon of the downstream ORF (jamA or jamI). Relative activity was calculated on same scale as Figure 4. Standard error is represented by error bars.
