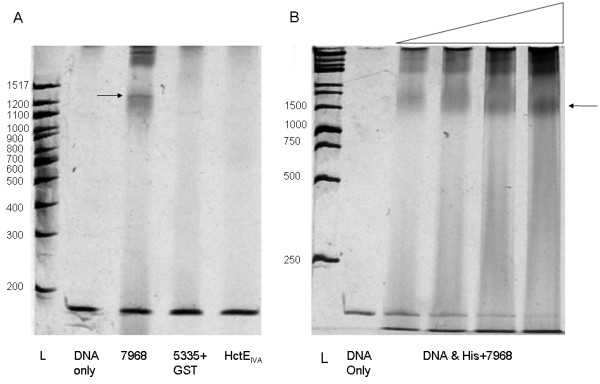
Figure 9.

Electromobility shift assays. A) EMSA gel shift assay with DNA region -1000 - -832 bp upstream of jamA. DNA [270 fmol (= 30 ng)] was assayed with (from left to right) no protein, 7.3 pmol of 7968, 8.4 pmol of GST+5335, or 31 pmol of HctEIVA. Arrow indicates DNA + protein shift for 7968. B) Serial titration experiment with 45 fmol (= 5 ng) of the same DNA region with (from left to right) no protein, 6.8 pmol, 13.7 pmol, 27.3 pmol, or 54.8 pmol His+7968. Arrow indicates DNA + protein shift.
