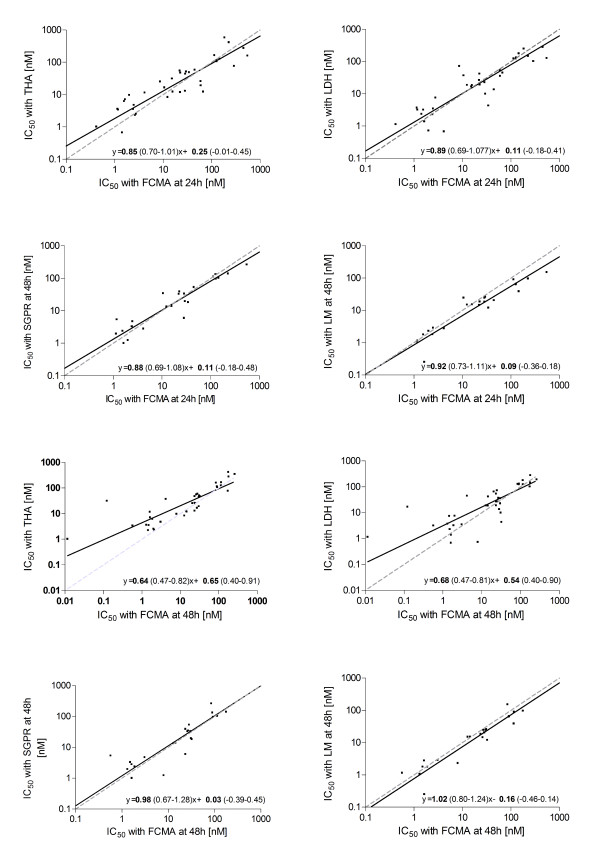
Figure 5.
Orthogonal linear regression (Deming model) for pair-wise comparison of the different assays. Panel A: FCMA at 24 h and THA, Panel B: FCMA at 24 h and LDH, Panel C: FCMA at 24 h and SGPR, Panel D: FCMA at 24 h and LM. Panel E: FCMA at 48 h and THA, Panel F: FCMA at 48 h and LDH, Panel G: FCMA at 48 h and SGPR, Panel H: FCMA at 48 h and LM The solid black lines are the best fit lines of the regression. The dashed grey lines represent the line of identity. Regression equations are given with each plot together with the 95% confidence intervals on the fitted parameters.

