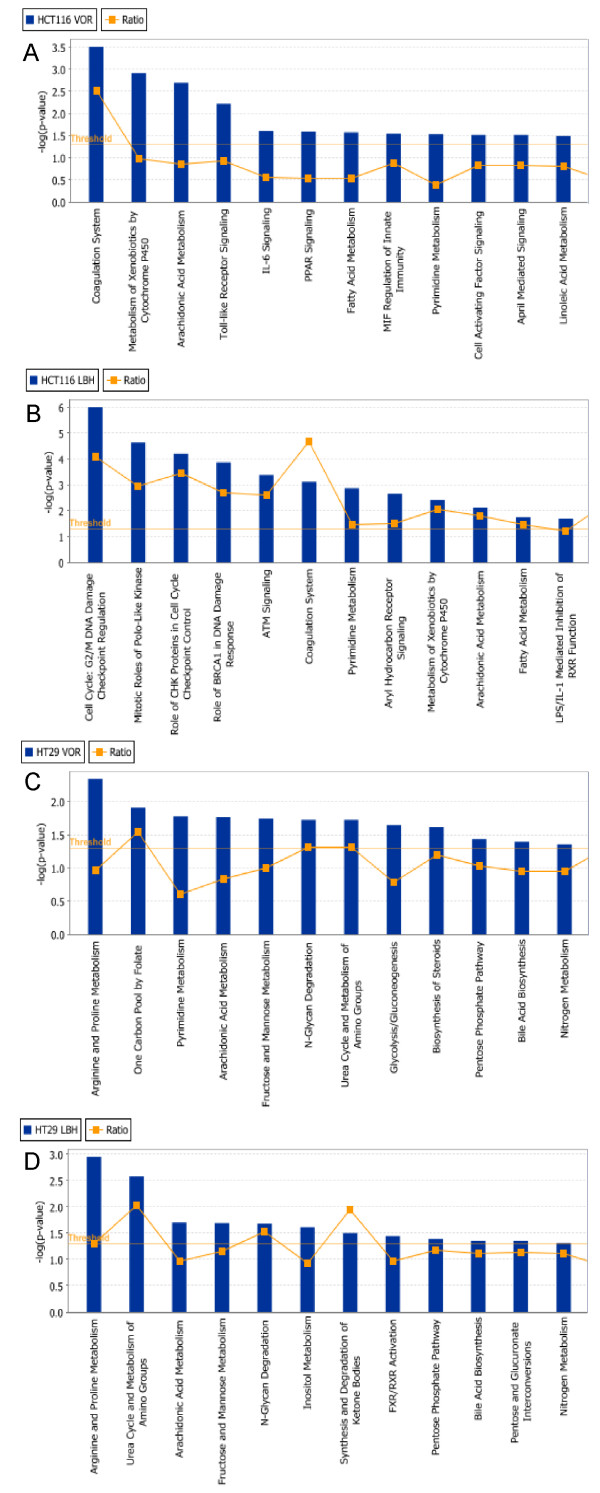
Figure 5.
Top 12 canonical pathways that were significantly modulated by HDACi as identified by Ingenuity® Pathway Analysis (IPA). HCT116 colon cancer cells treated for 24 h with (A) 2 μM vorinostat (Vor) or (B) 50 nM LBH589 (LBH); HT29 colon cancer cells treated for 24 h with (C) 2 μM vorinostat (Vor) or (D) 50 nM LBH589 (LBH). 2289 of the 3043 differentially expressed genes (DEGs) in the HCT116 and 1679 of the 2232 DEGs in the HT29 cancer cell lines mapped to defined genetic networks in IPA. Fisher's exact test was used to calculate a p-value determining the probability that the association between the genes in the dataset and the canonical pathway is explained by chance alone. A ratio of the number of genes from the dataset that map to the pathway divided by the total number of molecules in a given pathway that meet the cut criteria, divided by the total number of molecules that make up that pathway is displayed.

