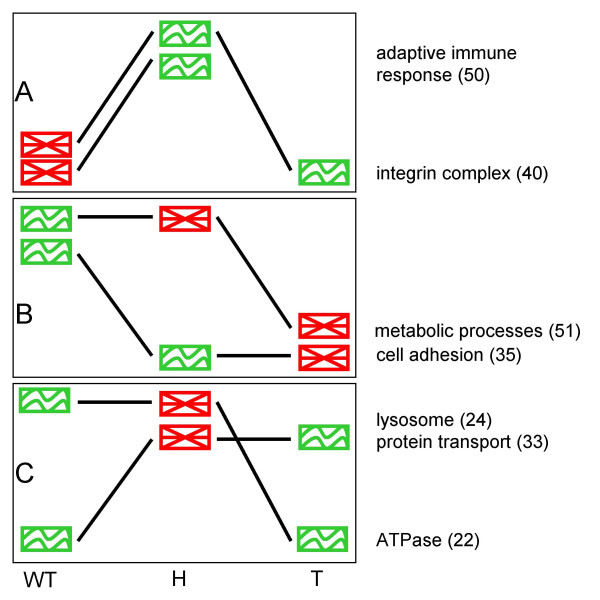
Figure 3.
Patterns of the interplay between differential expression and coexpression. Patterns of the changes in expression level and coexpression of the modules. The graphics show the coexpression state of the module (red - genes in the module not coexpressed; green - coexpressed) in three conditions (from left to right: healthy, hyperplastic and tumor). The slopes of the lines indicate relative increase or decrease of the mean expression level of the genes in the module between the samples. (A) Activation of the modules via upregulation and increased coregulation (in cancer sample expression of immune response module remains on the similar level, and it is neither declared coexpressed nor not coexpressed); (B) Deactivation of the modules through downregulation and dysregulation; (C) Modules become transiently disordered in hyperplastic tissue. Numbers in the parentheses indicate the module IDs.

