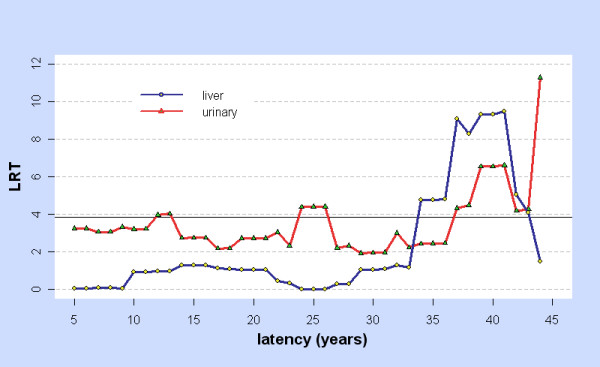
Figure 1.

LRT for Linear vs. Control model: liver and urinary. For cancers of the liver (blue) and urinary (red) and for latency ϕ = 5, 6,... 44 years, LRT = LRTlin-con,ϕ is the Likelihood Ratio Test for comparing the linear and control models at latency ϕ. Values above the horizontal line LRT = 3.841 are significant at p < 0.05.
