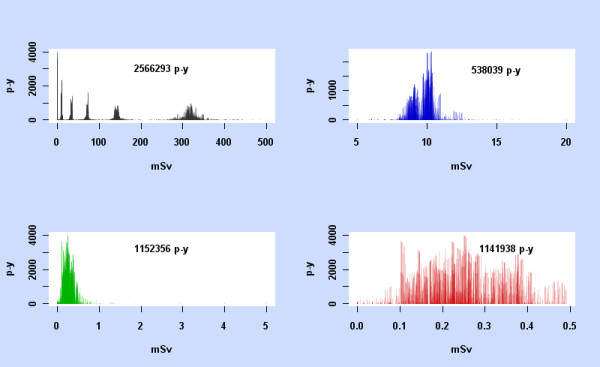
Figure 6.

p-y observation against mean dose. For the subcohorts 0-500 mSv, 5-20 mSv, 0-5 mSv, and 0-0.5 mSv, each data cell in the subcohort is represented by a vertical line at its mean dose, with height the p-y observation in the data cell. The total p-y observation for each subcohort is also shown.
