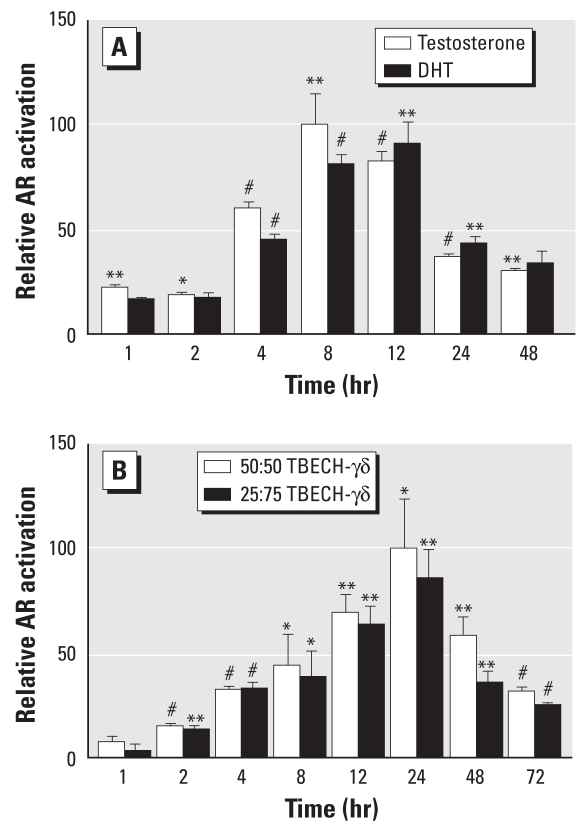
Figure 4.
In vitro analysis of AR activation using HepG2 cells were transfected with both the slp-ARE-Luc reporter vector and AR expression vector pCMVhAR. (A) Time-dependent activation of AR after exposure to 100 nM T and 10 nM DHT. (B) Time-dependent activation of AR after exposure to 50:50 TBECH-γδ or 25:75 TBECH-γδ at a final concentration of 1 μM. All values were normalized against the controls; the control levels were arbitrarily set to 1, and maximal induction was set to 100%. n= 4 per exposure group.
*p < 0.05, **p < 0.01, and #p < 0.001 by Student’s t-test compared with controls.

