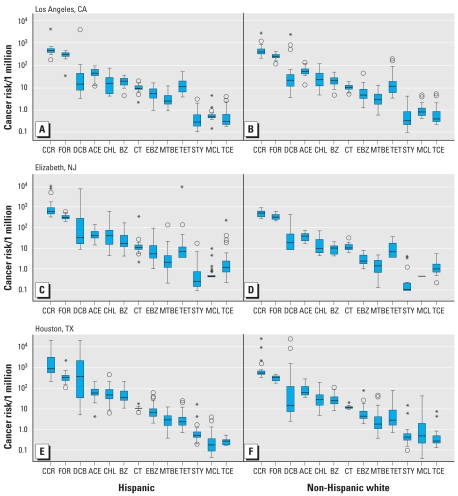
Figure 1.
Distributions of cancer risks based on personal concentrations of Hispanics and whites in Los Angeles (A and B), Elizabeth (C and D), and Houston (E and F). Boxes represent 25th and 75th percentiles, whiskers indicate lower and upper range, and the black line is the median. Circles indicate values between 1.5 and 3 times the interquartile range. Asterisks demonstrate values > 3 times the interquartile range. Hispanic: Los Angeles, n = 23; Elizabeth, n = 54; Houston, n = 44. Non-Hispanic white: Los Angeles, n = 43; Elizabeth, n = 15; Houston, n = 36. Abbreviations: ACE, acetaldehyde; BZ, benzene; CCR, cumulative cancer risk; CHL, chloroform; CT, carbon tetrachloride; DCB, p-dichlorobenzene; EBZ, ethylbenzene; FOR, formaldehyde; MCL, methylene chloride; MTBE, methyl tert-butyl ether; STY, styrene; TCE, trichloroethylene; TET, tetrachloroethylene.

