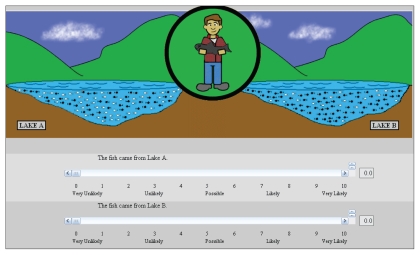
Fig. 1.
Sample screen shot of the fishing task. Differences in ratios of black to white fish in each lake for each series were represented graphically. The fisherman was updated for each catch to display the colour of the current fish catch. Following each catch, participants were instructed to make separate ratings using the 2 sliding scales of the likelihood that the fish were being caught exclusively from Lake A and the likelihood that they were being caught exclusively from Lake B.

