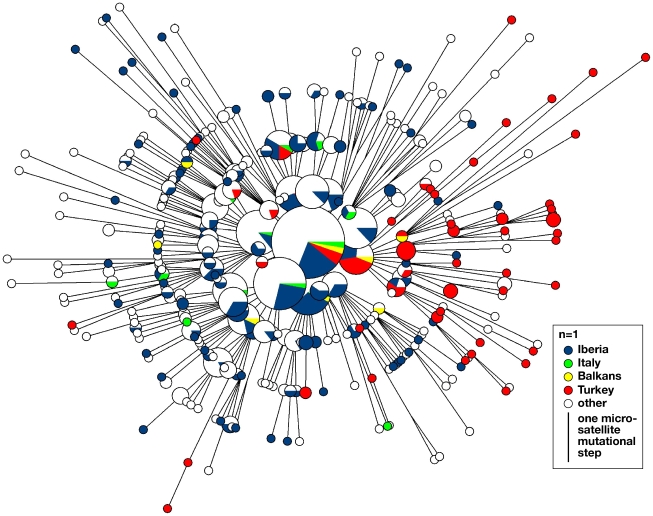
Figure 3. Reduced median network of microsatellite haplotypes within haplogroup R1b1b2.
Molecular relationships between the nine-locus microsatellite haplotypes of 849 hgR1b1b2 chromosomes, including seven Serbian and two Greek haplotypes not included in the other analyses because population sample sizes were too small. Circles represent haplotypes, with area proportional to frequency and coloured according to population. Lines between circles represent microsatellite mutational steps.

