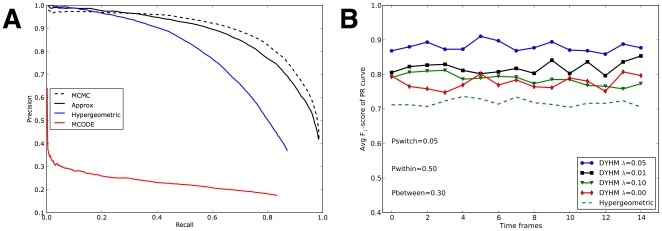
Figure 1. Simulation study.
(A) Comparison on static synthetic networks. From top to bottom, lines correspond Precision-Recall curves of four different methods. Dashed black: Hierarchical model trained by MCMC sampling. Solid black: Hierarchical model trained by variational approximation. Solid blue: Hypergeometric method [17]. Solid red: MCODE [16]. (B) Comparison on dynamic synthetic networks. From top to bottom, lines denote correspond to F scores over time frames. Blue circle: DYHM with
  . Black squre: DYHM with
  . Green triangle: DYHM with
  . Red diamond: DYHM with
  . Dashed green: Hypergeometric method [17] applied separately to each each time frame.

