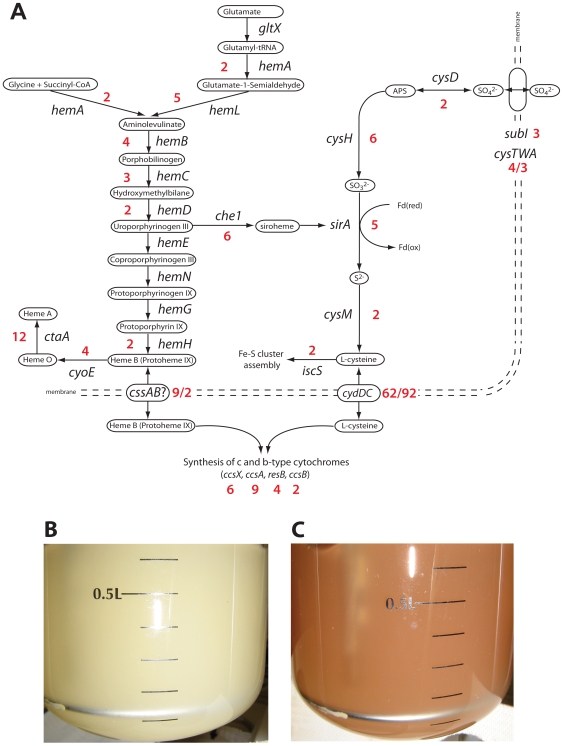
Figure 3. Effect of oxygen limitation on M. smegmatis growing at slow growth rate.
(A) Diagram of the upregulated heme, cysteine and cytochrome c biosynthesis pathways in M. smegmatis under oxygen-limited growth. Numbers in red represent gene expression ratios (0.6% oxygen saturation/50% oxygen saturation) above the 2-fold threshold. B&C: Comparison of M. smegmatis mc2155 wild type growing in continuous culture at a dilution rate of 0.01 h−1 (69 h doubling time) with 50% oxygen saturation (B) or 0.6% oxygen saturation (C).

