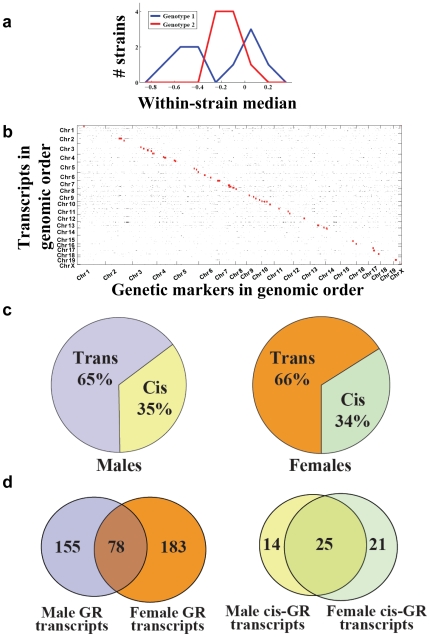
Figure 2. Genetic robustness QTLs in mouse.
a. An example of a GR QTL in the mouse gene expression data set. A histogram of expression levels from mice of one genotype (red) form a tight unimodal distribution, while those of the other genotype (blue) form a much wider bimodal distribution. The median values for each genotype are required not to be significantly different. b. GR QTLs in males. Transcripts are arranged in the genomic order of their genes along the Y-axis and genetic markers are in genomic order along the X-axis. Small black dots located at the intersection of a particular row and column indicate trans-acting hits between the trait/marker combination represented by that row/column; larger red dots indicate cis-acting hits. c. Left pane: the estimated fraction of true-positive male GR hits that is cis-acting. Right pane: the same as the left pane, for females. d. Left pane: the overlap between male and female GR QTLs. Right pane: the overlap between male and female cis-acting GR QTLs.

