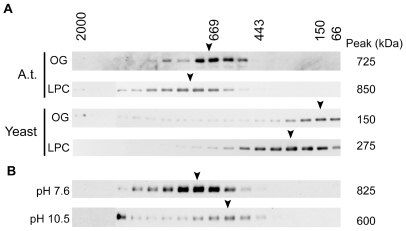
Figure 1. Gel-filtration analysis of ETR1 isolated from its native Arabidopsis or after transgenic expression in yeast.
Microsomal fractions were solubilized with octylglucoside (OG) or lysophosphatidyl choline (LPC), and the proteins fractionated on Superose 6HR. ETR1 was detected by immunoblot analysis of the fractions. The estimated molecular mass of the ETR1 complex is indicated to the right of each immunoblot. Positions of the molecular mass markers used to calibrate the column are indicated above. (A) Elution profile of ETR1 from Arabidopsis (A.t.) from plants grown in liquid culture or after transgenic expression in yeast. (B) Effect of pH treatment upon size of the ETR1 complex from Arabidopsis. Microsomes were treated with buffers of either pH 7.6 or 10.5 prior to LPC-solubilization and gel-filtration analysis.

