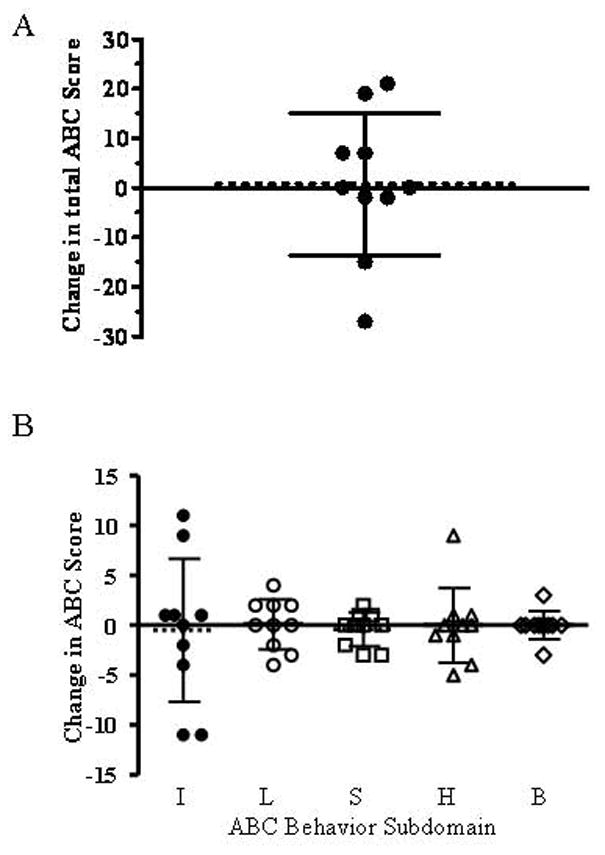
Figure 3. Individual changes in Aberrant Behavior Checklist scores.

The change in the individual subjects total ABC score (A) and subdomain scores (B) are presented. Decreased scores indicate improved behavior. The mean score is indicated by a dashed line and the error bars indicate the standard deviation. Subdomain scales include irritability (I), lethargy (L), stereotypy (S), hyperactivity (H), and inappropriate behavior (B). Mean values were −0.5, 0.1, −0.4, 0, and 0 points respectively.
