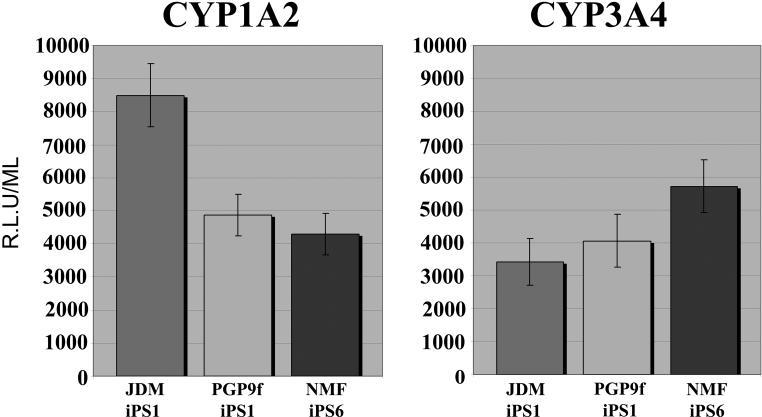
Figure 4. iPSC-derived hepatic endoderm displays cytochrome P450 metabolism.
iPSC-derived hepatic endoderm were incubated with hepatocyte culture medium supplemented with 50 μM of CYP3A4 or CYP1A2 pGlo TM substrates (Promega) as per manufacturers instructions. 4 hours post-treatment 50 μl of culture medium was removed and read on a luminometer (POLARstar optima). CYP1A2 and CYP3A4 activity is expressed as relative light units (R.L.U.)/ml of tissue culture medium. (n=6). CYP1A2 activity was similar on cells maintained on both ECMs. Luciferase activity is expressed as relative light units (R.L.U.)/ml of tissue culture media. JDM-iPS1 is presented by the first bar in all graphs, PGP9f-iPS1 is represented by the middle bar in each graph and NMF-iPS6 is represented by the last bar in each graph.

