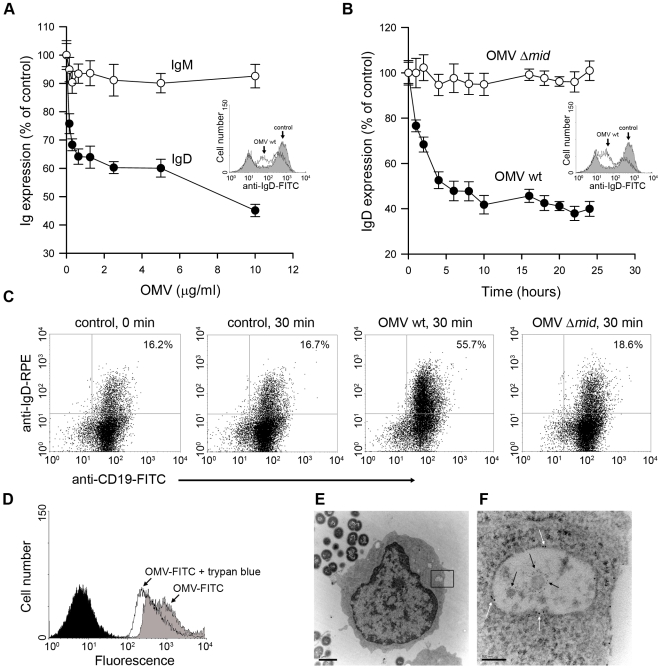
Figure 4. OMV induce a down-regulation of surface expressed IgD in a dose dependent manner and are internalised by tonsilar B cells.
Changes in surface expression of IgD and IgM after OMV binding to B cells were analyzed by flow cytometry. (A) Purified tonsil B cells were incubated with different concentrations of OMV ranging from 150 ng/ml to 10 µg/ml and monitored for IgD and IgM expression after 24 h at 37°C. Insert shows a representative flow cytometry profile of IgD-labelled B cells that were left unstimulated (shaded) or stimulated with OMV (white). (B) The kinetics of IgD internalization was examined after incubation with 10 µg of either OMV wild type (OMV-wt) or MID-deficient OMV (OMV-Δmid). Data are shown as arbitrary units comparing Ig densities at different time-points with expression at time 0 h set to 100%. Error bars indicate SEM from four and three different donors in panels A and B, respectively. Insert shows a representative flow cytometry profile of IgD-labelled B cells that were unstimulated (shaded) or stimulated with OMV wt (white). (C) The IgD internalization after OMV stimulation was examined by flow cytometry. Unstimulated (control) B cells or B cells stimulated with 10 µg/ml of OMV wild type (OMV wt) or MID-deficient OMV (OMV Δmid) were fixed and incubated with FITC-conjugated anti-CD19 mAb and rabbit anti-IgD pAb to block the surface expressed BCR. After several washes, B cells were permeabilized and incubated with RPE-conjugated anti-IgD mAb and analyzed by flow cytometry. The data shown are representative of those from three independent experiments. (D) Representative flow cytometry experiment of OMV entry into B cells. Control B cells (shaded) and cells incubated with FITC–labeled OMV before (OMV-FITC) and after quenching with trypan blue (OMV-FITC + trypan blue). (E, F) B cells and OMV interactions analyzed in TEM showed internalisation of MID containing OMV. The endosome with two OMV is magnified in (F) and gold-labelled antibodies against IgD (large granules; white arrows) and MID (small granules; black arrows) are indicated. The scale in (E) and (F) represents 1 µm and 100 nm in length, respectively.

