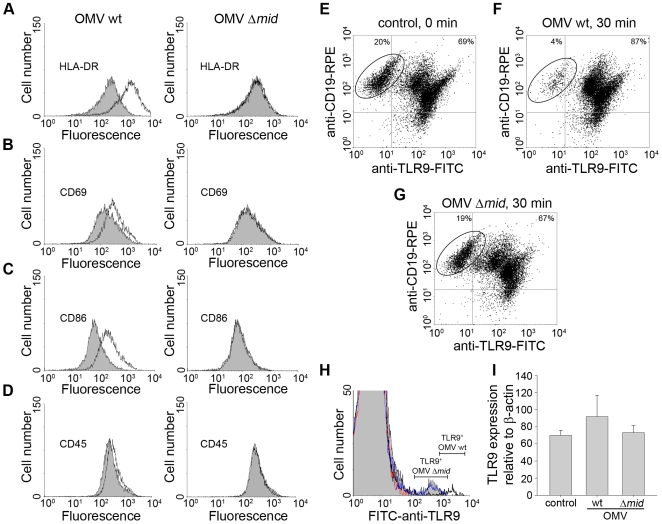
Figure 6. OMV cause up-regulation of B cell surface markers.
OMV induced changes in expression of HLA-DR (A), CD86 (B), CD69 (C) and CD45 (D). Surface expression of B cell activation markers after OMV stimulation was analyzed by flow cytometry. Unstimulated B cells are shown as filled profiles (gray) and B cells incubated with OMV wt (left panels) or MID-deficient OMV (OMV Δmid, right panels) are indicated as white profiles. Representative results from one out of three donors are shown. (E–G) Flow cytometry analysis of TLR9 expression in B cells stimulated with OMV. Purified B cells were either unstimulated (E) or incubated with 10 µg/ml of OMV-wt (F) or OMV-Δmid (G) for 30 min. Thereafter, B cells were double stained with RPE-conjugated anti-CD19 and FITC-conjugated anti-TLR9 mAbs followed by flow cytometry analysis. In panels (E) to (G), the TLR9-negative CD19+ B cell population is encircled to illustrate the CD19+TLR9− population that decreased after stimulation. Data are representative for 3 similar profiles obtained from separate donors. (H) Flow cytometry analysis of surface TLR9 expression in OMV-stimulated B cells. Unstimulated B cells are shown as a grey profile. B cells stimulated with OMV wt or MID-deficient OMV for 30 min are shown as dark black and blue line profile, respectively. Isotype control Ab-labelled B cells are shown as a red line profile. One representative histogram is shown out of three independent experiments. (I) Relative levels of TLR9 transcripts in OMV-stimulated human tonsillar B cells. Purified B cells were either unstimulated (control) or incubated with 10 µg/ml OMV wild type (OMV wt) or MID-deficient OMV (OMV Δmid) for 30 min. Expression levels were determined using quantitative real-time reverse transcription-polymerase chain reaction (RT-PCR) and are depicted in relation to the internal control gene, β-actin, as 2ΔCt×105. Data from experiments with cells from 3 different donors are summarized and presented as mean±SEM.

