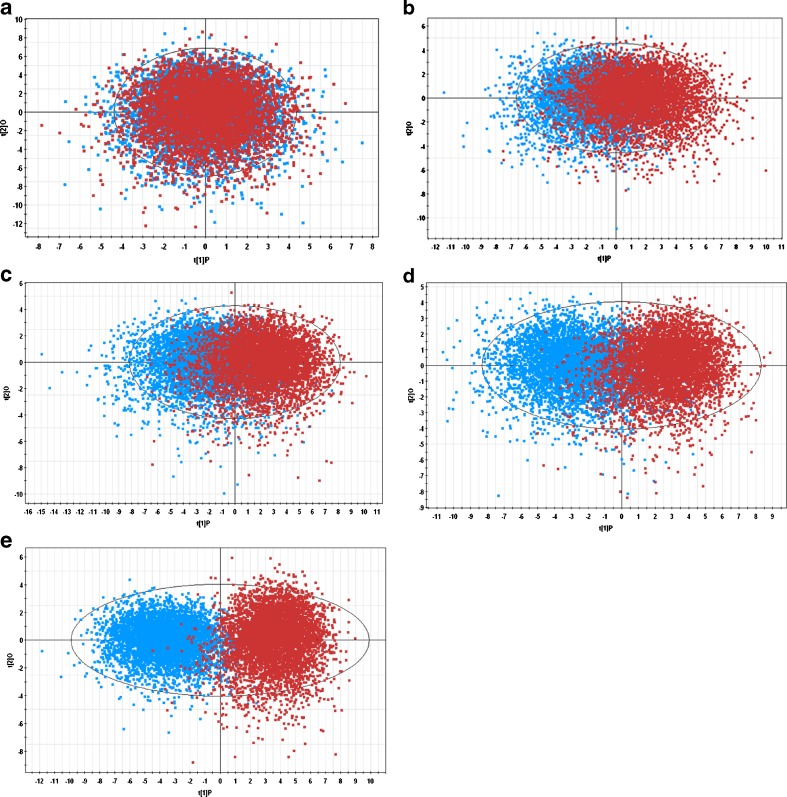
Fig. 3.
Score plot of orthogonal partial least square analysis to compare reference and test profiles generated by Monte Carlo simulation (5,000). Each data point in the score plot represents a whole profile (deposition on all sites). Reference profiles are colored blue and test profiles are colored red. a Reference profiles from scenario 1a were compared with itself (two separate simulations). b–e Reference profiles were compared with test profiles from scenarios 1a, 1b, 1c, and 1d respectively

