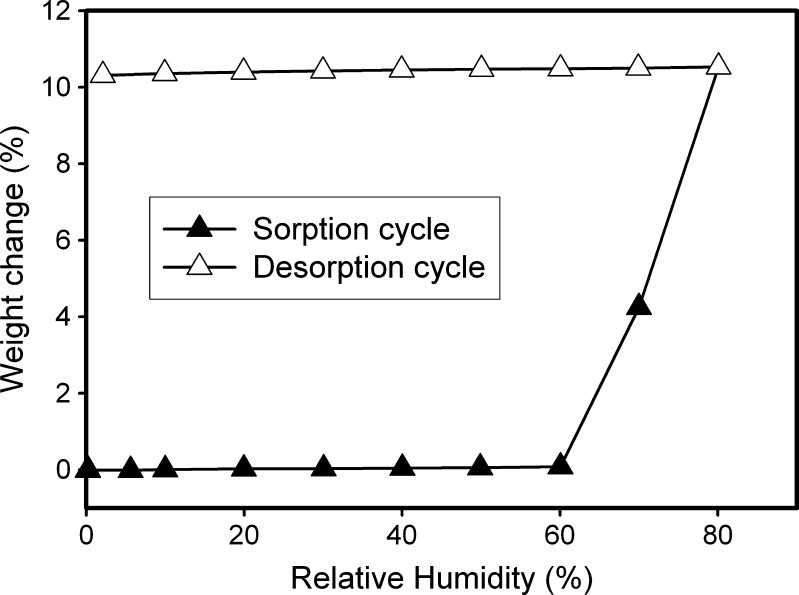
Fig. 6.
Water sorption–desorption profile of  (25°C). The sample was equilibrated at 0% RH for 100 min, and then the RH was progressively increased in steps of 10% RH to 80%, with a hold time of 100 min at each step. The RH was then progressively lowered in decrements of 10% to 0% RH with 100 min of hold time at every step. The weight gain, at the end of the sorption cycle (80% RH), was calculated on the basis of the dry weight at 0% RH

