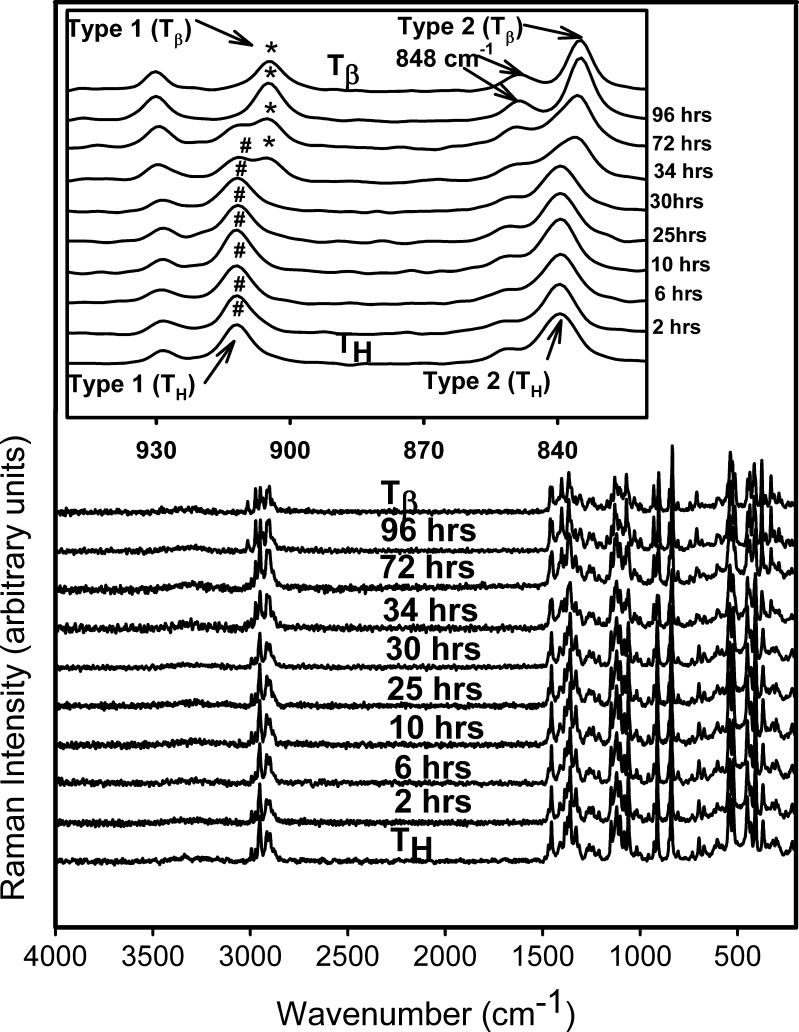
Fig. 8.
Raman spectra collected periodically following storage of T
H at 11% RH (60°C). The spectra of T
H and  are provided for comparison. The 950–820 cm−1 range has been highlighted in the inset. The type 1 band of
  appeared at 34 h of storage. At the same time, the type 2 band of T
H shifted to a lower wavenumber (characteristic of
  ) and its shoulder developed into a peak at 848 cm−1

