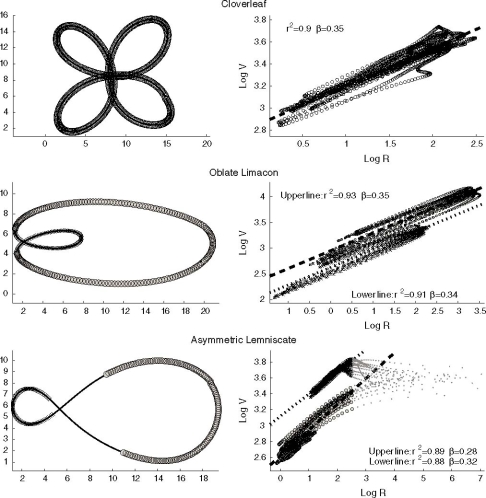
Fig. 5.
Plots of log Euclidean speed (V) versus log radius of curvature (R) for three figures: cloverleaf (top row), oblate limaçon (middle row) and figure eight (bottom row). One cycle of drawing (left column) and several superimposed log V versus log R plots for several repetitions of the drawing (right column) for each figural form are shown. For the cloverleaf the data points of the drawing (upper left panel) aremarked by circles and the corresponding points in the log V versus log R plot (upper right panel) are approximated by a single straight line (r2 = 0.9, β = 0.35). For the oblate limaçon (middle row), the data points of the drawing (middle left panel) are marked by circles (for the exterior larger loop) and by crosses (for the interior smaller loop) and the corresponding data points in the log V versus log R plot (middle right panel) are similarly marked and are separately linearly approximated by two straight lines (r2 = 0.93 and β = 0.35 for the larger loop, upper line; r 2 = 0.91 β = 0.34 for the smaller loop, lower line). For the asymmetric lemniscate (bottom row), data points with curvature smaller than 0.08cm−1 are marked on the drawing (bottom left panel) by a solid line and on the plot of log V versus log R (bottom right panel) by gray dots. The rest of the drawing data points are divided into two according to the two loops of the asymmetric lemniscate, and are marked by circles and crosses, for the large and small loops, respectively (bottom left panel). The corresponding data points in the log V versus log R plot (bottom right panel) are again separately linearly approximated (r2 = 0.89, β = 0.28 smaller loop, upper line; r2 = 0.88, β = 0.32, larger loop, lower line)

