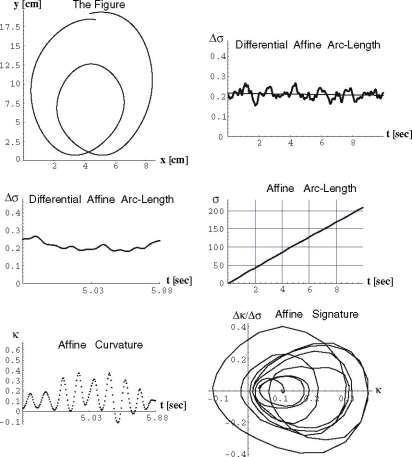
Fig. 7.
An Oblate Limaçon: typical results from the affine analysis of the drawings of an oblate limaçon. Shown are one cycle of drawing (upper left panel), a plot of the equi-affine speed versus time for several repetitions of the drawing of the limaçon (upper right panel), a “zoomed in” portion of the upper right panel, showing the equi-affine speed versus time for one complete cycle of the drawing (middle left panel) and a plot of the equi-affine arc-length versus time for several repetitions of the drawing (middle right panel). Also shown is a plot of the affine curvature versus time for one complete cycle of the oblate limaçon (bottom left panel) and the corresponding affine signature curve for one cycle of the drawing (bottom right panel)

