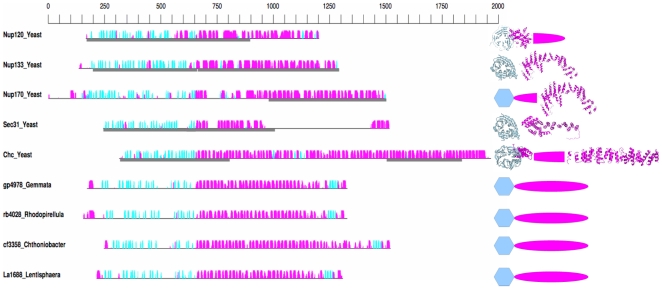
Figure 2. Secondary and tertiary structure of MC proteins.
Representative yeast and PVC MCs are illustrated. Left: predicted secondary structure. The amino-acid scale is represented at the top. The black horizontal line represents the sequence of each MC protein. The predicted secondary structure [52], α-helices (magenta) and β -strands (cyan) are indicated by colored bars above each line. The height of the bars is proportional to the confidence of the predictions. When an atomic structure is available, the corresponding fragment is highlighted by a grey box below the sequence. Sequences are aligned around the transition from mainly β-sheet to mainly α-helical. Right: predicted and observed tertiary structure: Predicted fold types are represented by coloured shapes, cyan hexagon for β-propeller and magenta oval for SPAH domain. Where known, the atomic structure is represented with the same coloring scheme. PDB codes of the represented structures are 3hxr [8] and 3f7f [9], Nup120; 1xks [10] and 3i4r [12], Nup133; 3i5p [12], Nup170; 1bpo [53] and 1b89 [54], clathrin; and 2pm6 and 2pm9 [55], Sec31. Chc, clathrin heavy chain.

