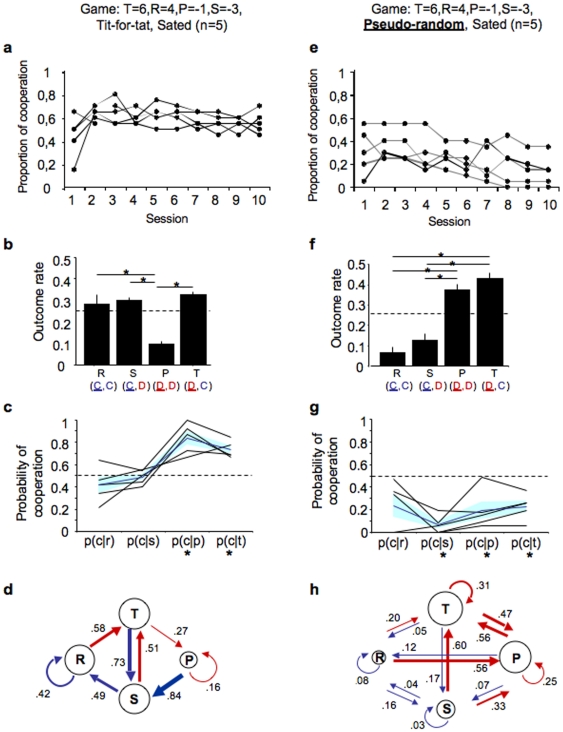
Figure 1. Rats adapt their behaviour to the strategy of the opponent.
Sated rats playing under a matrix T = 6, R = 4, P = −1, S = −3 against a Tit-for-Tat (TFT) opponent (a–d) or a pseudo-random (PR) opponent (e–h). (a,e) Line graph showing the cooperation rate of each rat throughout the game sessions. (b,f) Bar graph shows incidence rate of all outcomes when cooperation reaches stability (mean±s.e.m.; see Materials and Methods). For each outcome, the moves of the target (underlined) and of the stooge rat are indicated in the graph legend. Asterisks denote significant difference between means (Multiple pairwise comparisons, using Nemenyi's Procedure, two tailed, Bonferroni corrected, P<0.0083). (c,g) Line graph showing probability of cooperation (at trial, t = 0) after x outcome (at trial, t = −1), P(C0|X−1), where X = T, R, P or S. Black lines represent P(C0|X−1), for each target rat, the dark blue line represents the mean P(C0|X−1) and the light blue band shows the s.e.m. (d,h) diagram showing the probability of transition between outcomes. Arrows represent transitions: driven by cooperation in blue, and driven by defection in red (arrow thickness proportional to transition probability). Asterisks denote significant difference from chance P<0.0083 (see Materials and Methods). T, temptation; R, reward; P, punishment; S, Sucker; C, cooperation; D, defection.

