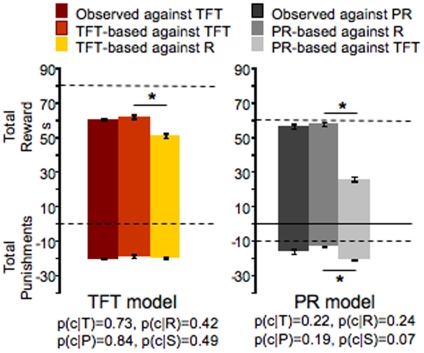
Figure 2. Rats adjust their strategy to the behaviour of the opponent.
Simulated games using TFT and PR were performed using the empirically determined cooperation probabilities after each outcome, T, R, P and S, of the game (see Figure 1d and h). (left panel) Bar graph showing average outcome, rewards and punishments, per session (sum of 20 trials) of the experimental TFT game and, TFT-based simulation against TFT and Random. (right panel) Bar graph showing average outcome, rewards and punishments, per session (sum of 20 trials) of the experimental PR game and, PR-based simulation against TFT and Random. Dashed lines represent the theoretically predicted optimal values for a 20-trial session when the opponent is playing TFT (panel a) and Random (panel b).

