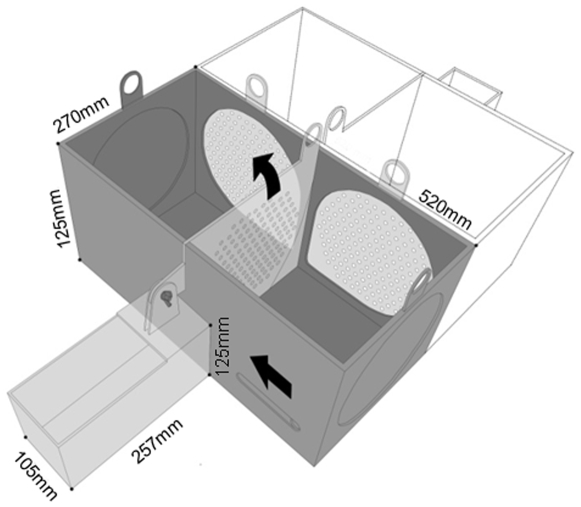
Figure 6. T-maze diagram.
Diagram of the double T-maze used in the presented experiments. One T-maze is represented in grey with its respective start box and two choice compartments. In dashed lines is shown the identical opposing T-maze. Arrows show the movement direction of the start box door and of the partition between compartments.

