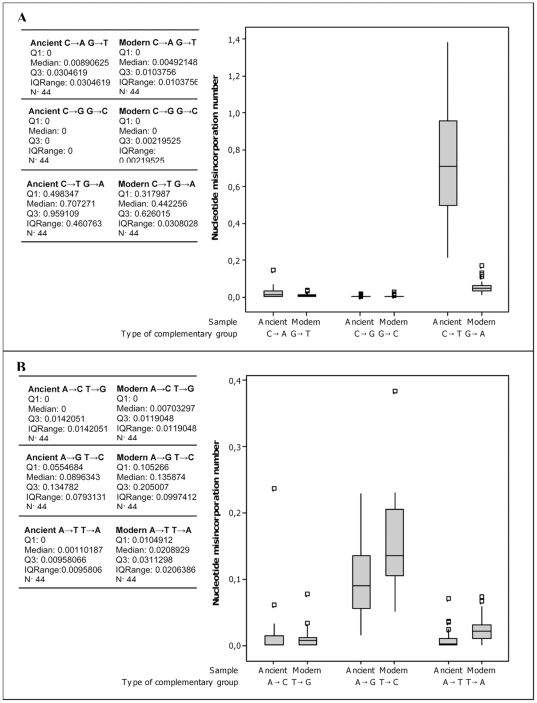
Figure 3. Nucleotide misincorporations number for each complementary group in the ancient and modern sequences.
Nucleotide misincorporations originally derived from G and C nucleotides. (B) Nucleotide misincorporations originally derived from A and T nucleotides. The lesions number are standardized for the number of clones analysed for each mitochondrial fragment. The plot comprises a box and whiskers. A line is drawn across the box to represent the median; the bottom of the box is the first quartile (Q1) and the top is the third quartile (Q3). The lower whisker extends to the lowest value within the lower limit, while the upper whisker extends to the highest value within the upper limit. The limits are defined by: Q1−1.5 (Q3−Q1) (lower limit) and Q3+1.5 (Q3−Q1) (upper limit). The square (□) represent the outlier, a value beyond the whiskers.

