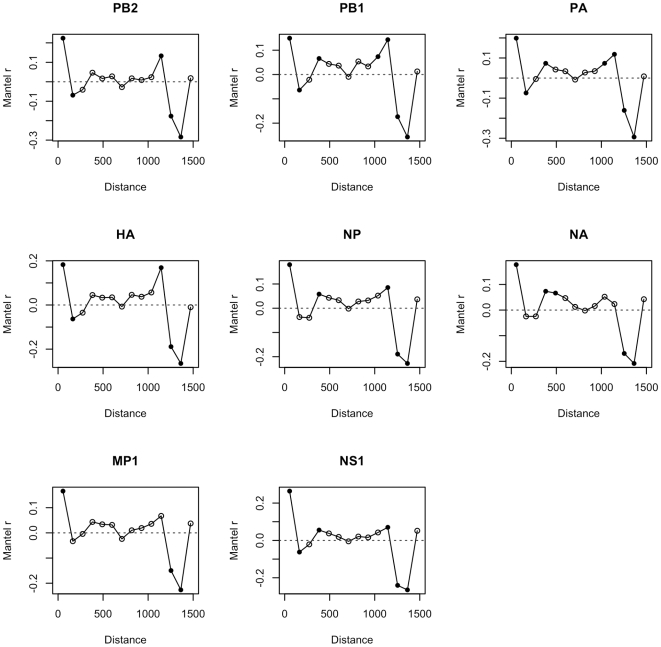
Figure 4. Mantel spatial correlograms, stratified by influenza gene segment.
Correlograms show the relationship between geographic distance (x-axis) and the Mantel r correlation score (y-axis) of HK821-like HPAIVs. Under the null hypothesis of no relationship between geographic location and genetic similarity, all points would be on the zero line. Points above the zero line indicate lower genetic distance between case pairs. Points below the zero line indicate greater genetic distance between case pairs. Solid symbols are statistically significant, hollow symbols are not. The sharp rise to the furthest point in the correlograms is an artifact of edge effects caused by the spatial structure of the data, and does not indicate genetic similarity at the highest geographic distances between viruses.

