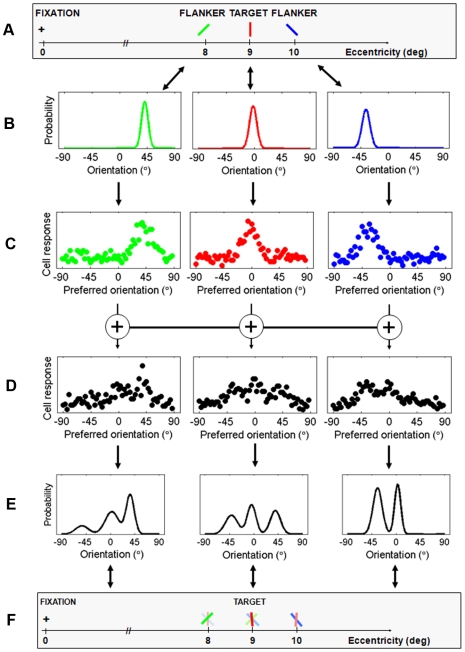
Figure 2. A graphical illustration of our model.
A. In this example, the input consists of three oriented bars (the colors are only for visualization purposes and not part of the input to the model); B. Probability distributions are defined for the input stimuli; these distributions capture the stimulus uncertainty caused by neural noise in processing stages prior to the first layer of the model; C. In the first layer, a neural representation is computed for each of these distributions; D. In the second layer, the stimulus representation at each location is integrated with the representations of stimuli at neighboring locations. Integration is implemented as a weighted summation, such that nearby stimuli receive higher weights than stimuli that are far away; E. The resulting population codes are decoded to a mixture of normal distributions, with each component representing a perceived orientation at the respective location; F. Due to integration, the resulting percept of closely spaced stimuli will be crowded.

