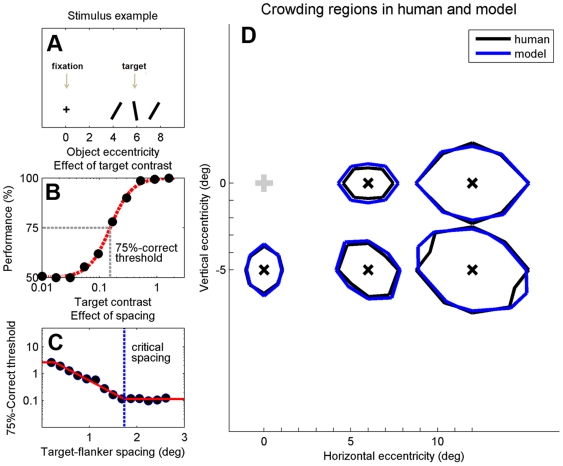
Figure 3. Comparison of crowding regions reported for humans with crowding regions estimated by our model.
A. The input stimulus on each trial consisted of a ±10° tilted target stimulus and two 30° tilted flankers placed on opposite sides of the target. If the sign of the post-integration stimulus representation associated with the target position was the same as the sign of the input target, then performance on that trial was considered correct; B. Performance was estimated for a range of target contrasts, yielding a curve that is very similar to psychometric curves typically found with human experiments (compare, for example, with data shown in Figure 1). Based on these curves, contrast thresholds were estimated that produce 75% correct performance; C. Contrast thresholds decrease as target-flanker spacing is increased. The smallest spacing at which the flankers do not have an effect is defined as the critical spacing; D. Critical spacings were estimated in several directions around the target, at five different target positions. These simulation data accurately reproduce the critical regions measured psychophysically in humans. Human data from [15].

