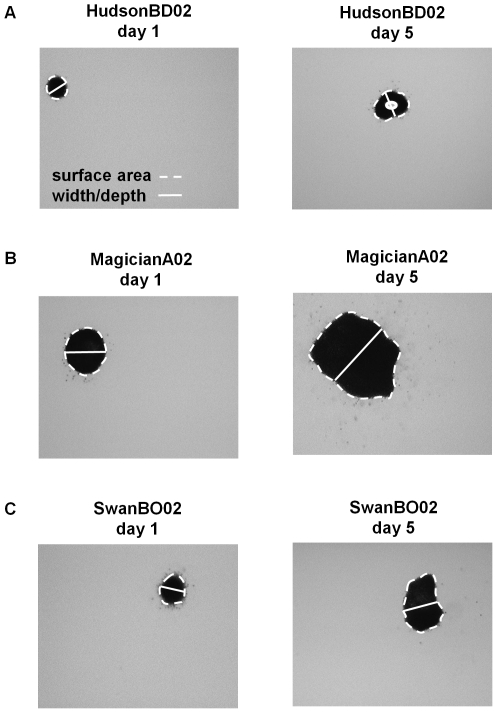
Figure 1. Microcystis aeruginosa colony size measurements.
The surface area and width of individual colonies was measured using microscopy and digital image analysis. Example measurements for individual colonies of three M. aeruginosa genotypes ((A) HudsonBD02, (B) MagicianA02, and (C) SwanBO02) measured on days 1 and 5. Stippled white line was traced with a mouse for estimation of surface area. Solid white line represents our approximation of colony depth (see text for explanation). For HudsonBD02 (A), the perimeter of the void in the center of the colony was also traced and its estimated surface area was subtracted from the total surface area. All photos taken at 63× magnification.

