
Fig. 3.
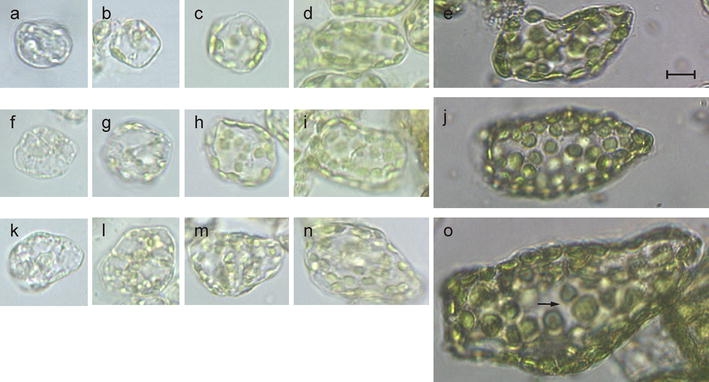
Representative cells from central lamina areas of leaf material shown in Fig. 1a–f that was used for morphometry and organelle isolation. a–e A developmental series of diploid, f–j triploid, and k–o tetraploid sugar beet. a, f, k reflect cells from 0.2 to 0.9 cm-leaflet fractions I/II (Fig. 1f, e), b, g, l 0.5–2.2 cm-leaflet fractions II/III (Fig. 1d, e), c, h, m 1.0–2.2 cm-leaf fraction III (Fig. 1d), d, i, n 2.5–6 cm-leaf fractions IV–V (Fig. 1c, b), and e, j, o 15–25 cm-leaf fraction VII. Note size variation of individual chloroplasts in o (arrow). Bar 10 μm