Fig. 1.
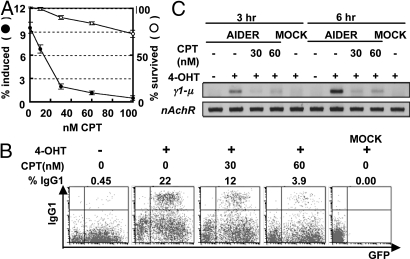
CPT blocks CSR in CH12F3–2 cells and splenic B cells. (A) The percentages of the IgA+ and propidium iodide (PI)− alive cells are presented as closed and open circles, respectively. Each circle represents average with S.D. (n = 3). The backgrounds (subtracted) of IgA+ and PI+ cells at 0 nM CPT were 1.26 and 11.5%, respectively. (B) AID−/− spleen cells were infected by AIDER-IRES-GFP retrovirus. Twenty-four hours later, the cells were treated with 1 μM 4-OHT or EtOH in the presence of 30 to 60 nM CPT. After an additional 24-h incubation, surface IgG1 and GFP expression were analyzed by flow cytometry with biotinylated anti-IgG1 antibody and streptavidin-APC. The percentage of IgG1 switch in the GFP positive cells is shown above each plot. Mock, no retrovirus control. (C) Sγ1-Sμ DC-PCR. Before the flow cytometry in panel B, part of cells were collected 3 and 6 h after 4-OHT and CPT addition. Extracted genomic DNA was then subjected to DC-PCR for the Sγ1-Sμ recombination (γ1-μ) and for the nicotinic acetylcholine receptor (nAchR) locus as control. PCR products were run on a 2% agarose gel and visualized by ethidium bromide.

