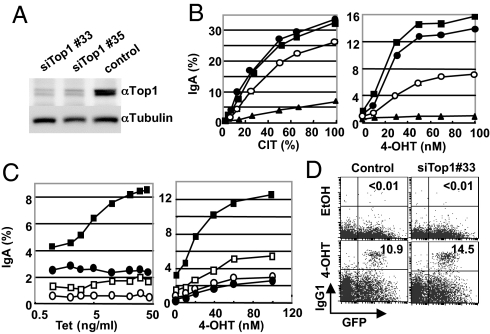
Fig. 5.
Top1 knockdown enhances CSR in AER and splenic B cells. (A) The Top1 protein level in AER cells was measured by Western blot 48 h after electroporation with the indicated siRNA. (B) Top1 knocked-down AER cells were stimulated with various concentrations of CIT (Left) or 4-OHT (Right) for 24 h, and the surface IgA expression was quantified by flow cytometry. siRNAs used are as follows; closed circles, siTop1#33; squares, siTop#35; triangles, siAID; open circles, control. (C) Knockdown of Top1 was performed in AER cells carrying the Tet-inducible microRNA (miR)-Top1 construct as described in Materials and Methods. The surface IgA expression was quantified by flow cytometry 24 h after 4-OHT addition. Squares, miR-Top1; circles, miR-neg. (Left) Cells were exposed to indicated concentrations of Tet for 24 h, and then incubated with 1 μM of 4-OHT. Closed and open symbols, with and without 4-OHT, respectively. (Right) Cells were initially exposed to 1 μg/mL doxycycline for 24 h and then CSR was induced by indicated concentrations of 4-OHT. Closed and open symbols, with and without doxycycline, respectively. (D) Top1 knockdown augmented CSR in splenic B cells. AIDER-induced CSR in the control siRNA- and Top1 siRNA(#33)-treated splenic B cells. AID−/− splenic cells were cultured for 24 h after siRNA introduction and then infected by the AIDER-IRES-GFP retrovirus. The surface IgG1 and GFP levels were analyzed by flow cytometry 24 h after 4-OHT addition. Numbers in the quadrants are the percentages of switched cells among the GFP positive population.

