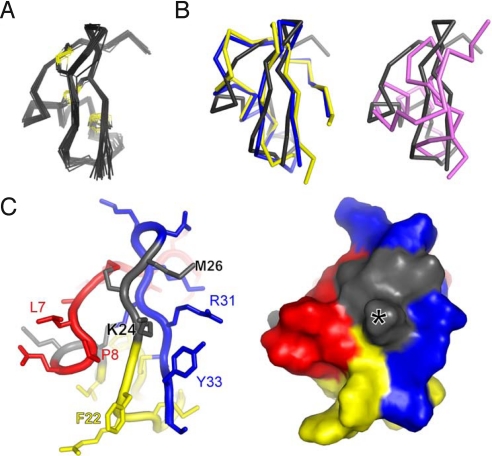
Fig. 2.
Structure of moka1. Production of [U-13C, 15N]-moka1 and NMR spectroscopy are described in SI Materials and Methods. Statistics of the final structures are in Table S7 (A) Moka1 retains the α-KTx fold. NMR-derived solution structure of moka1 (PDB ID code 2kir). The Cα traces (gray) of 20 structures of moka1 are superimposed. The Cys residue side chains and the disulfide bonds are shown in yellow. (B Left) Superposition of the structure of moka1 (gray) with CTX (blue; PDB ID code 2crd) and AgTx2 (yellow, PDB ID code 1agt). (Right) Superposition of the structure of KTX (purple; PDB ID code 1ktx) and moka1 (gray). (C) The moka1 surface that is predicted to interact with the channel is shown en face in stick (Left) and surface representations (Right). Portions of moka1 originating from parental toxins are marked with different colors: Ce3 (red), AgTx2 (yellow), and CTX (blue). Residues common to all (QC and KCM) are shown in gray. Moka1 Lys24 equivalent to KTX Lys27 that is inserted in the channel pore is marked by an asterisk (*).

