Fig. 3.
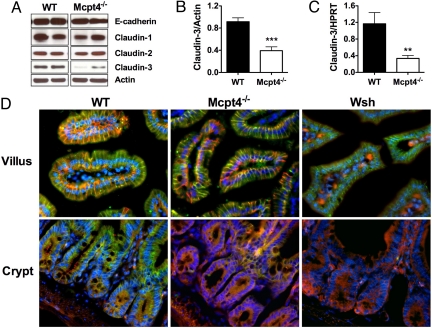
Decreased claudin-3 expression in jejunal crypt epithelium of Mcpt4−/− and Wsh mice. (A) E-cadherin, claudin-1, -2, and -3 and actin were evaluated by Western blot. (B) Densitometric analysis of claudin-3 expression normalized to β-actin. (C) Quantitative real-time PCR analysis of claudin-3 normalized to HPRT. (D) Claudin-3 (green) and E-cadherin (red) immunofluorescence of the villi (Top) and crypts (Bottom) of jejunum from WT (Left), Mcpt4−/− (Middle), and Wsh (Right) mice; nuclei stained by DAPI (blue). Western representative of three individual experiments. Densitometry represents mean ± SEM; n = 10 mice. PCR represents n = 6–8 mice per group. Statistical significance is: **, P < 0.01, ***, P < 0.001.

