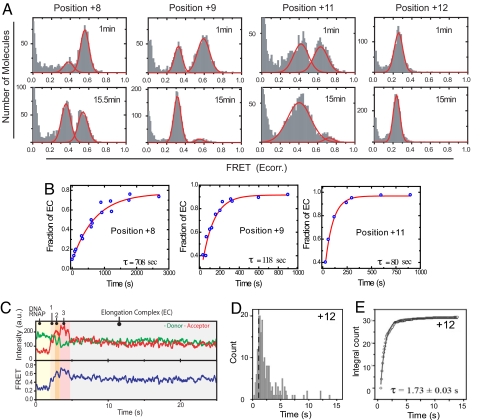
Fig. 3.
Kinetics of IC-to-EC transition measured by single-molecule FRET. (A) Distribution of FRET values of the halted complexes 1 min and 15 min after reaction start. Data for +8, +9, and +11 were fitted to two Gaussian distributions (smoothed curves), and data for +12 were fitted to a single distribution to quantify IC and EC fractions. (B) The fraction of EC increases with single-exponential kinetics, with the time of reaction providing the indicated mean τ. (C) Single-molecule FRET time trajectory of transcription reaction halted at +12 measured by using the DNA SM-NT2. (Upper) Time course of donor and acceptor intensities. (Lower) The apparent FRET, Eapp, calculated without the γ correction factor in Eq. 1. (D) Dwell times in the high-FRET state (State 3 in C) were determined from >200 molecules. (E) Integrated frequency counts from the selected portion of the dwell time (right half of the dashed line in D) fit well to a single-exponential decay function to yield a mean τ of 1.7 s for EC formation at +12.

