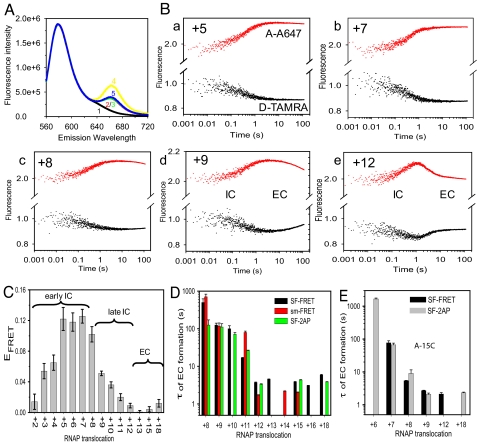
Fig. 4.
T7 RNAP transcription measured by stopped-flow FRET. (A) Fluorescence emission spectra after excitation at 550 nm for the free DNA seq1 (100 nM) singly labeled with TAMRA at −22NT (curve 1) or doubly labeled with TAMRA (at −22NT) and A647 (at +18T) (curve 2), DNA in the binary complex with 150 nM T7 RNAP (curve 3), DNA in +6 halted complex (with 1 mM GTP plus 0.4 M ATP, curve 4), or +15 halted complex (with 1 mM GTP plus 0.4 mM ATP plus 0.4 mM CTP, curve 5). Donor fluorescence was normalized to that of D-only free DNA to display the sensitized acceptor fluorescence. (B) Representative real-time traces of donor (black) and acceptor (red) fluorescence intensity changes monitoring DNA conformational changes during transcription by T7 RNAP (a–e). (C) FRET values of complexes halted at various positions after 120 s of reaction start. (D) Mean τ values of EC formation from stopped-flow experiments (black bars; see B and Fig. S4), single-molecule experiments (red bars; see Fig. 3B), or 2AP fluorescence changes (green bars; see Fig. S6). Error bars show SD based on at least three independent measurements. (E) Mean τ values of EC formation on the A-15C promoter from stopped-flow FRET (black bars; see Fig. S7) and 2AP fluorescence (gray bars).

