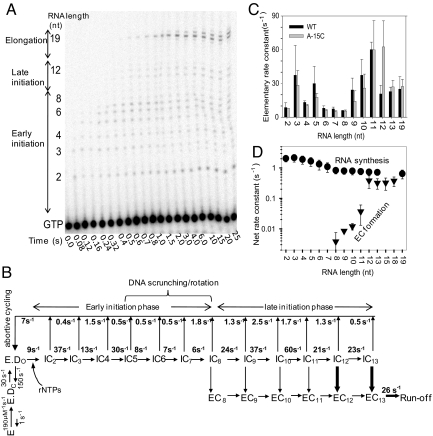
Fig. 5.
Kinetics of RNA synthesis. (A) Sequencing gel shows the time course of RNA synthesis (2- to 19-nt runoff) on the consensus T7 promoter (DNA sequence P-22 from refs. 8 and 44). (B) The complete transcription initiation pathway of T7 RNAP with the experimentally determined rate constants for each of the elementary steps. The rate constants for RNAP binding to the T7 consensus promoter and open complex formation were obtained from previous studies (32, 35). The rate constants of RNA synthesis and RNA dissociation were derived from global fit of the RNA-elongation kinetics in A to the model in B (Fig. S8). Efficient EC formation from IC on 12/13-nt RNA is shown in bold arrows. (C) Elementary rate constants of 2- to 19-nt RNA synthesis steps for the consensus promoter (black bars) and the A-15C promoter (gray bars). Error bars represent the range of data from two or more measurements. (D) Net rate constants of making RNA of 2- to 19-nt lengths (circles) and EC formation (triangles) at those translocation steps on the consensus promoter. The net rate constants of EC formation were obtained from the data in Fig. 4D. The plotted values are means ± SE of measurements of three independent measurements.

