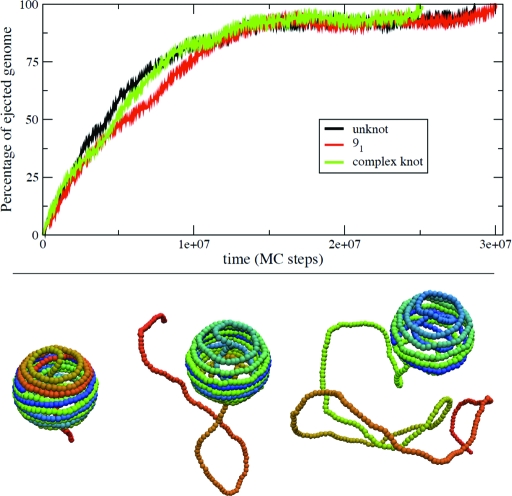
Fig. 4.
Percentage of ejected genome as a function of time (in simulation steps, each step corresponding to about 1–5 ns), for three different starting configurations of the fully loaded half-P4 genome. (Upper) The initial configurations correspond to an unknot (black curve), a 91 knot (red curve), and a knot that was too complex to be identified against a lookup table of prime knots of up to 16 crossings (green curve). The ejection proceeds in a fashion that is largely independent of the initial knotted state. A slowing down of the ejection is seen after 70% of the genome has ejected. The ejection speed up for the very last portion of the genome is ascribable to the entropic pulling of the expelled chain (this regime is expected to be sensitive to various details such as the presence of a phage tail). (Lower) Snapshots of the ejection process for the 91 initial knot.

