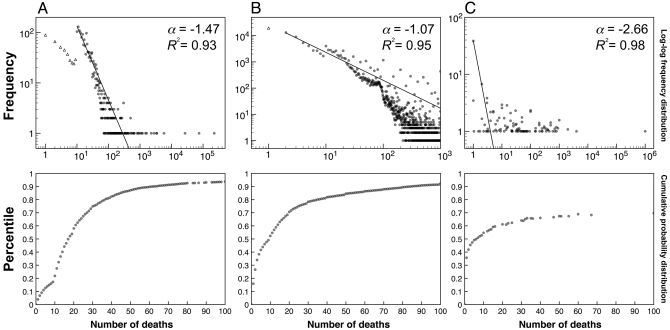
Fig. 1.
Log-log plots of EADT frequency distributions (Top) and their corresponding cumulative probability distributions shown up to 100 deaths (Bottom). Solid lines (Top) are best-fitting power-functions of the frequency data, with the associated power parameter estimate (α) and model fit (R2) displayed (Top Right). (A) Fatalities from natural and industrial disasters occurring in 2003 through 2007. The power-law function is fitted to events involving 10 or more deaths (dots) because frequencies are underestimated for events involving fewer than 10 deaths (triangles; see SI Text). The cumulative probability distribution plot is based on all of the data (triangles and dots). (B) Media attention (in 2000–2007) to mortality-related events. The power-law function is fitted to events involving two or more deaths (dots) because media attention to events involving a single death (triangle) is likely underestimated (see SI Text). The cumulative probability distribution plot is based on all the data (triangle and dots), as well as estimated frequencies for events involving more than 1,000 deaths (see SI Text). (C) Mean recalled EADTs occurring in a person's lifetime. Mean frequencies and mean percentile-ranks were obtained by repeatedly and randomly sampling the events that respondents recalled (see SI Text).

