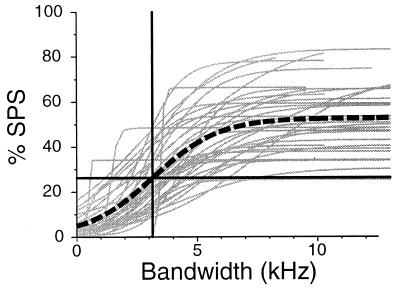
Figure 4.
The amount of SPS observed as a function of stimulus bandwidth, for the entire population of 37 cells. Light gray curves show sigmoid fits for individual cells (n = 37), heavy dashed curve represents a composite %SPS curve calculated by fitting the entire data set (n = 420 samples) with a single sigmoid; the intersection of the horizontal and vertical heavy lines indicates the 50% maximum suppression level (27%SPS) at 3.1 kHz.

