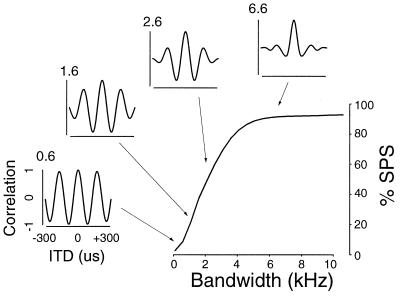
Figure 5.
Results of mathematically cross-correlating band-limited noise signals similar to those used in the experiments (Gaussian filter, μ = 5 kHz, σ = bandwidth). The main figure shows %SPS as a function of signal bandwidth, measured in the same manner used to assay %SPS in vivo. (Insets) Graphs correspond to the actual CCFs calculated for representative signal bandwidths (values in upper left of insets indicate actual signal bandwidth).

