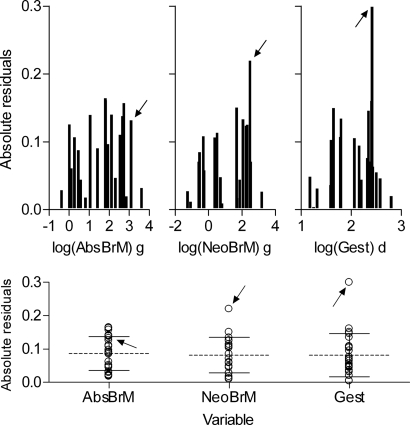
Fig. 3.
Residuals from regression analyses in Fig. 2. (Upper) Absolute values of residuals as a function of, from left to right, absolute adult brain mass, log(AbsBrM), neonatal brain mass, log(NeoBrM), and gestation time, log(Gest). (Lower) Based on the same data as Upper, but with means and 1.0 SD indicated by horizontal longer dashed lines and shorter solid lines, respectively. Data points from humans are indicated by arrows in all diagrams.

