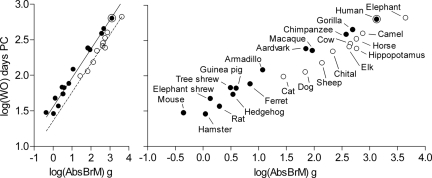
Fig. 4.
Absolute adult brain mass and hindlimb standing position as predictors of time to walking onset. (Left) Time to walking onset, log(WO), as a function of absolute adult brain mass, log(AbsBrM), and hindlimb standing position. Solid symbols and solid regression line represent species that can assume a plantigrade hindlimb standing position; open symbols and dashed regression line represent species that cannot assume a plantigrade hindlimb standing position (Table S2). Analysis of variance with covariance (ANCOVA) confirmed the overall robust main effect of adult brain mass as a covariate (F(1,24) = 820.51, P < 0.0001, η2 = 0.97) and revealed a main effect of hindlimb standing position as a grouping variable (F(1,24) = 40.39, P < 0.0001, η2 = 0.66). For the full model equation derived from multiple-regression analysis, R2 values, and P values, see main text. The 95% confidence interval for R2 was 0.95–0.99. (Right) The same as the Left panel, but with species indicated next to each data point for clarity. The Pearson correlation coefficient was 0.97 (two-tailed P < 0.0001; cf. Fig. S3). Axis units are as in Left but the x axis is expanded.

