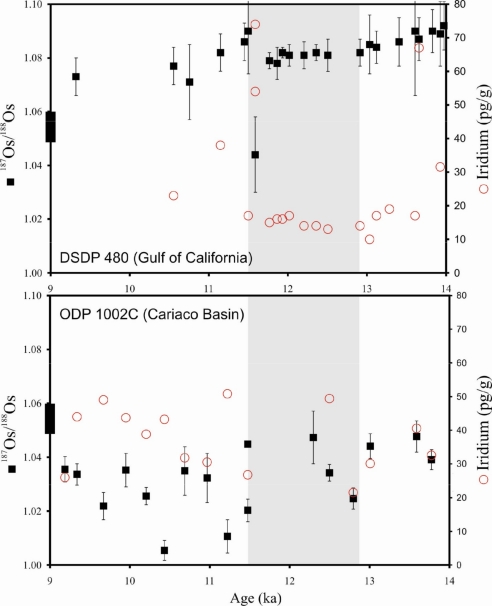
Fig. 2.
187Os/188Os ratios (black squares) and Ir concentrations (open red circles) in DSDP 480 (Gulf of California) and 1002C (Cariaco Basin) compared with the present seawater 187Os/188Os ratio (black vertical line on the y axis) (58–61). These age data are expressed as thousands of calendar years before present. The gray area represents the YD interval.

